Data Analytics Case Studies
Adidas Sales Performance Dashboard (2020–2021)
Project Overview
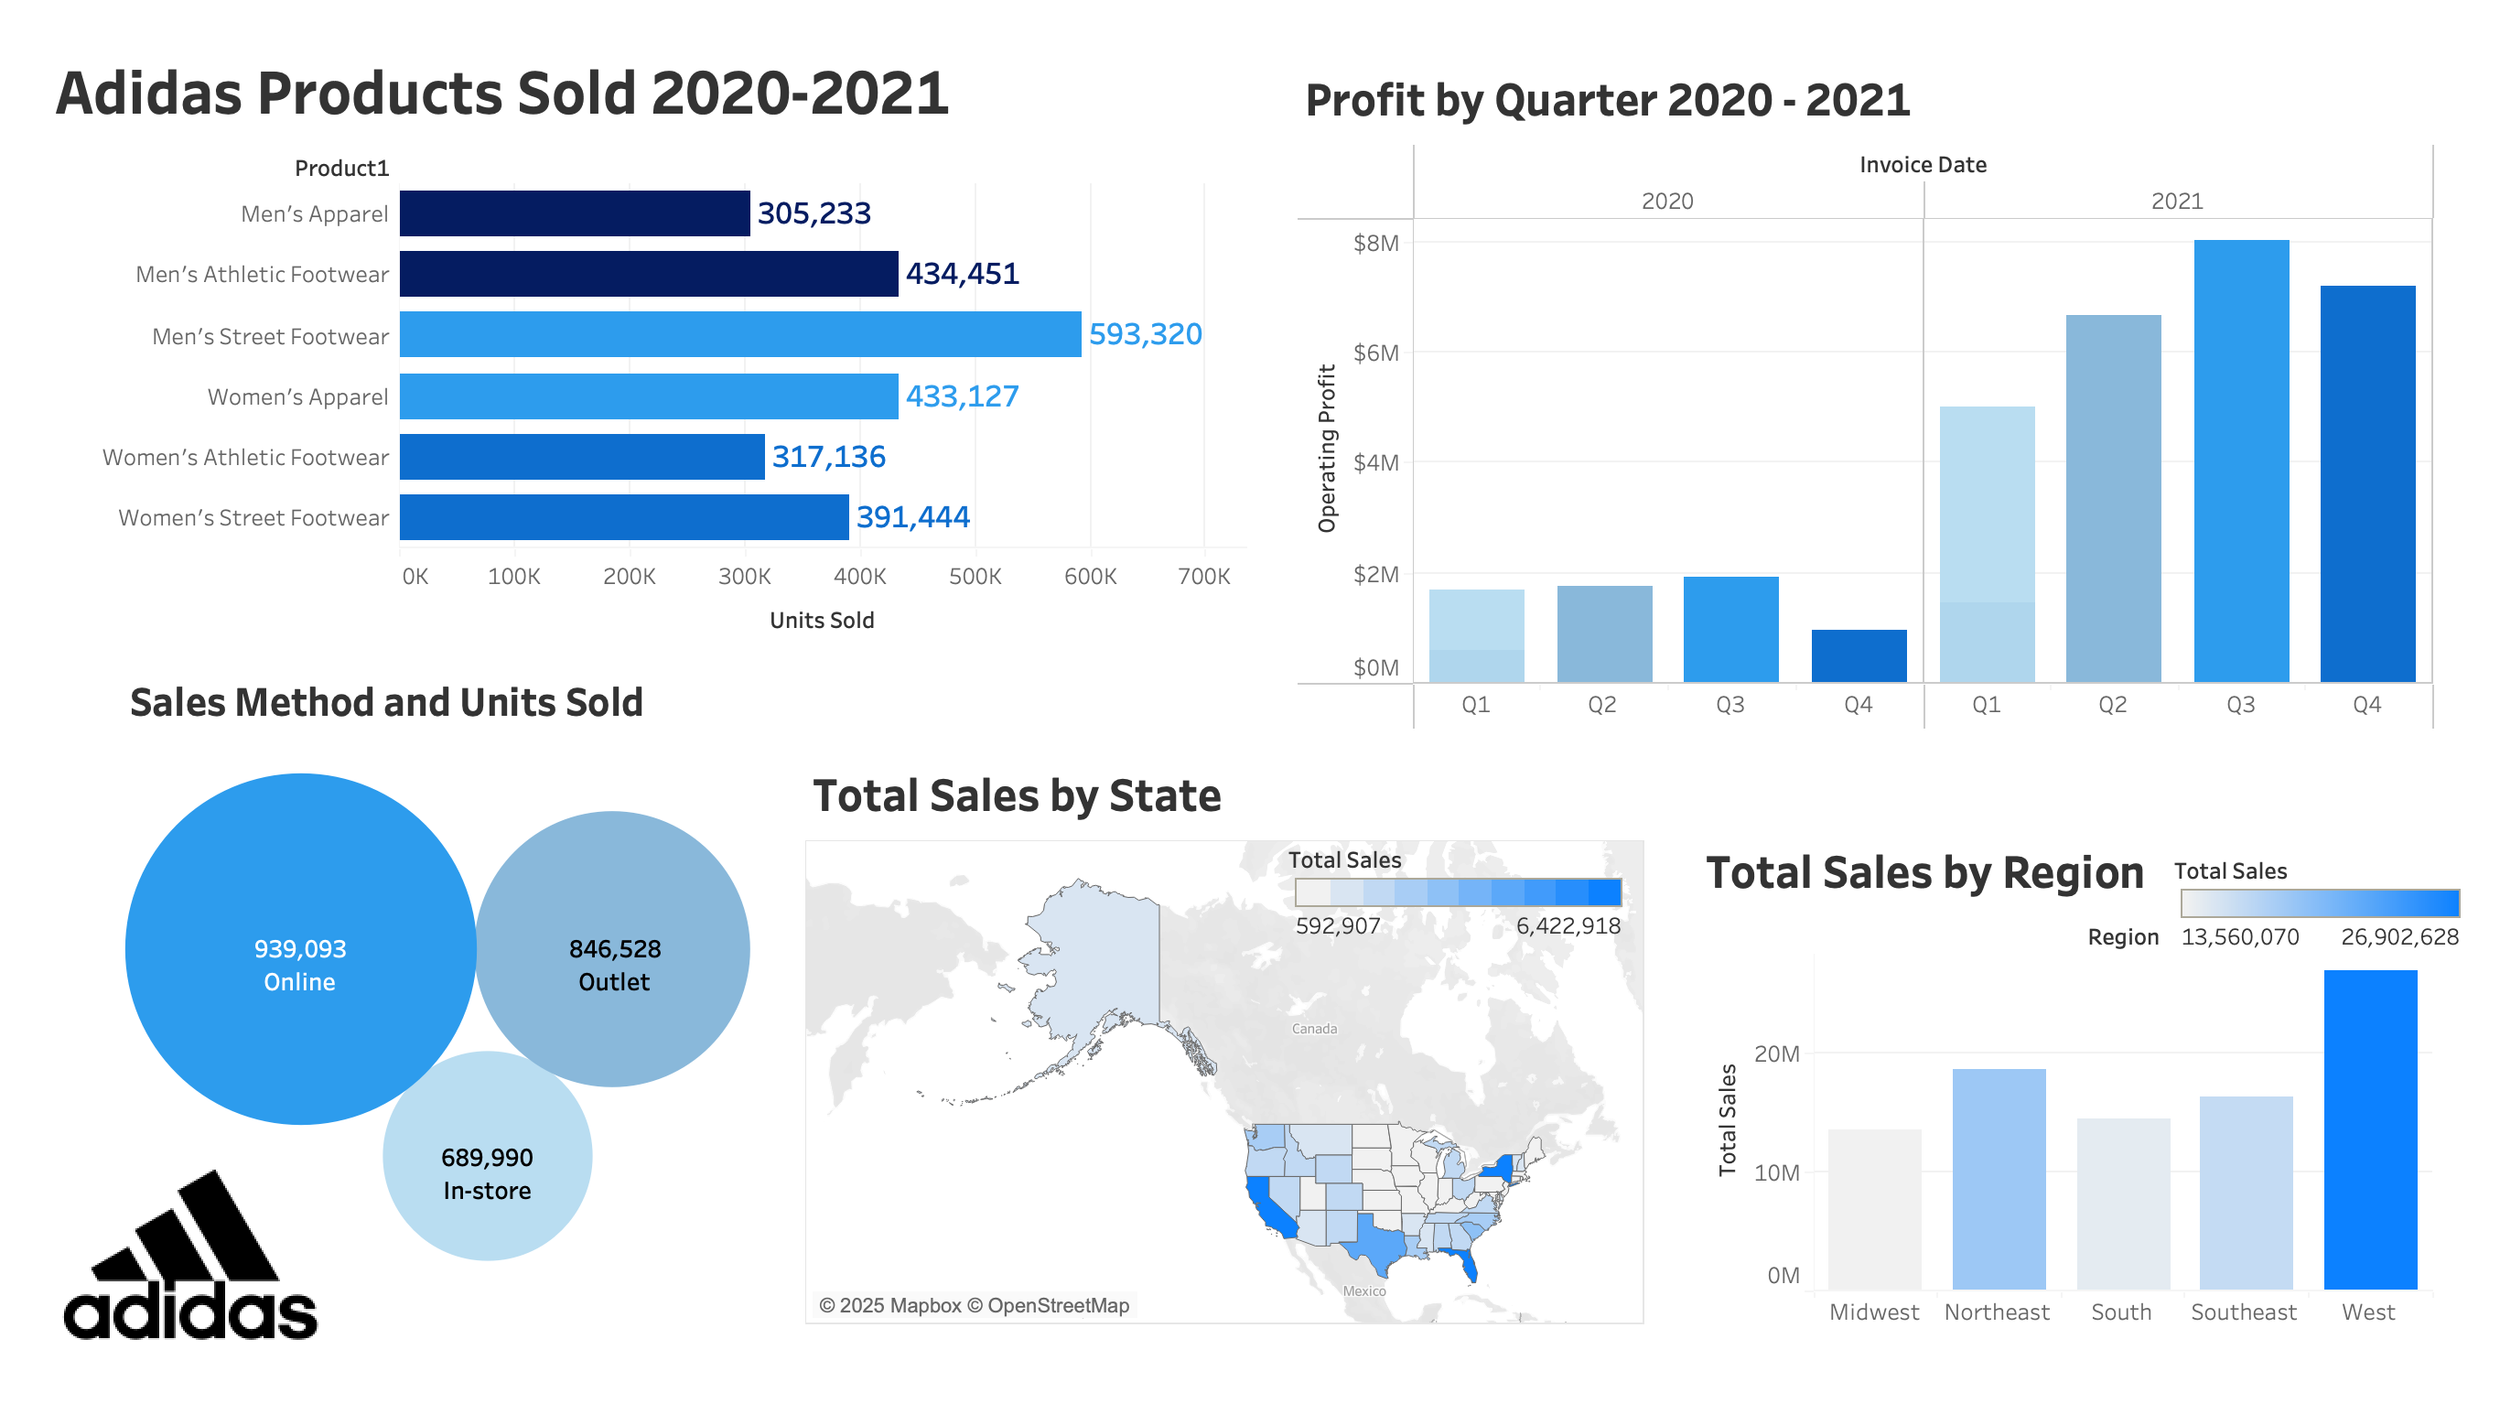
This case study explores over 1 million rows of Adidas sales data transformed into an interactive dashboard designed to uncover trends in profitability, product performance, sales channels, and geographic distribution. The goal was to translate complex, high-volume data into clear, actionable insights for business and marketing stakeholders.
-
Identify top-performing product categories across men’s and women’s lines
Analyze quarterly profit trends year-over-year (2020–2021)
Compare performance across sales methods (online, outlet, in-store)
Surface regional and state-level sales patterns to inform market strategy
Present insights in an intuitive, executive-ready visual format
-
Data Preparation & Cleaning
Consolidated raw sales data exceeding 1M records
Cleaned inconsistencies, standardized fields, and validated metrics in Excel
Structured data for efficient querying and visualization
Exploratory Data Analysis (EDA)
Analyzed revenue, profit, and units sold by product category and gender
Evaluated seasonal and quarterly performance trends
Assessed geographic concentration of sales by region and state
Dashboard Design & Visualization
Designed an interactive Tableau dashboard with multiple analytical views
Used bar charts, maps, and bubble charts to support quick insight discovery
Prioritized clarity, hierarchy, and usability for non-technical stakeholders
-
Identified Men’s Street Footwear as the top-selling product category
Revealed strong profit growth in 2021, with Q3 as the peak quarter
Confirmed online sales as the leading channel by volume
Highlighted the West region as the highest-grossing market
Enabled data-driven recommendations for inventory, marketing, and regional investment strategies
-
Tableau (Data Visualization)
Python
Microsoft Excel
Teen Smartphone Behavior & Addiction: Exploratory Data Analysis
Project Overview
This exploratory data analysis examines smartphone usage patterns among 3,000 teenagers (grades 7–12) to better understand how digital behaviors intersect with sleep, mental health, and addiction levels. Drawing from my background in UX/UI design, this project was motivated by growing concerns around intentional product design, persuasive technology, and their psychological impact on youth—concepts popularized in The Social Dilemma.
The analysis aims to move beyond assumptions about screen time and uncover whether commonly cited factors like social media usage actually correlate with anxiety, depression, sleep loss, or addiction.
-
Investigate relationships between screen time before bed and sleep duration
Explore whether social media usage correlates with anxiety and depression
Identify potential gender differences in smartphone addiction levels
Examine whether phone usage purpose is associated with addiction severity
Challenge common narratives using evidence-based analysis
-
1.Data Understanding & Codebook Development
Analyzed a dataset containing 25 behavioral, psychological, academic, and demographic variables
Classified each variable by conceptual data type (behavioral, psychological, ordinal, continuous, etc.)
Established a clear analytical framework to guide transformations and comparisons
2. Data Cleaning & Transformation
Converted numeric strings to appropriate quantitative formats
Standardized and categorized ordinal mental health measures into Low / Medium / High
Cleaned inconsistent gender labels and removed ambiguous entries to ensure analytical clarity
Reduced noise by rounding and normalizing behavioral metrics (e.g., screen time, sleep hours)
Resulted in a cleaned, analysis-ready dataset of ~2,000 participants
3. Feature Engineering & Subsetting
Created focused variable subsets aligned to each research question
Split and recombined demographic and behavioral data to support flexible analysis
Saved cleaned data to optimized formats for reproducibility and scalability
4. Exploratory Analysis & Visualization
Used histograms and bar charts to examine:
Sleep duration distributions
Screen time before bed
Social media usage patterns
Addiction level distributions
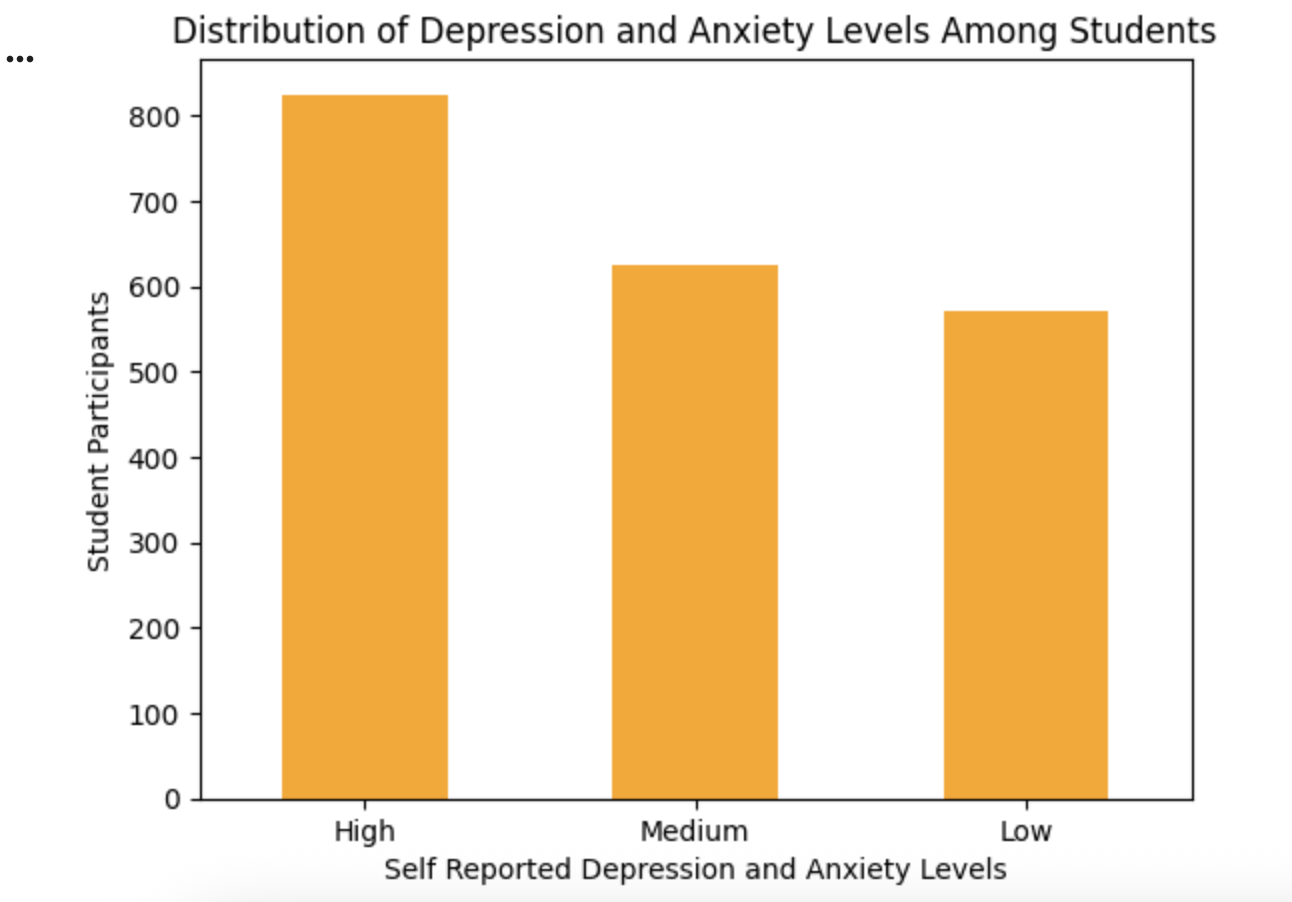
Mental health self-reports
Performed grouped aggregations to compare average behaviors across mental health categories
Iteratively refined research questions based on observed trends rather than assumptions
-
Fully cleaned and documented dataset
Reusable Python scripts for data preparation and transformation
Exploratory visualizations supporting behavioral and psychological analysis
Clearly framed analytical conclusions grounded in evidence, not correlation myths
This analysis reframes how smartphone addiction and mental health are discussed by:
Demonstrating the limits of screen time–only explanations
Highlighting the need for holistic, systems-level thinking
Offering UX professionals and educators a more nuanced foundation for ethical design and intervention strategies
-
Python (Pandas, Matplotlib, NumPy) — Data cleaning, transformation, analysis, and visualization
Jupyter Notebook — Reproducible EDA workflow
CSV & Feather formats — Optimized data storage and reuse